web analytics
Unlock insights, drive smarter decisions with web analytics.

As digital behaviour grows more complex, we use advanced analytics to help brands uncover insight, optimise performance, and drive measurable, profitable growth.
Building a complete view of performance
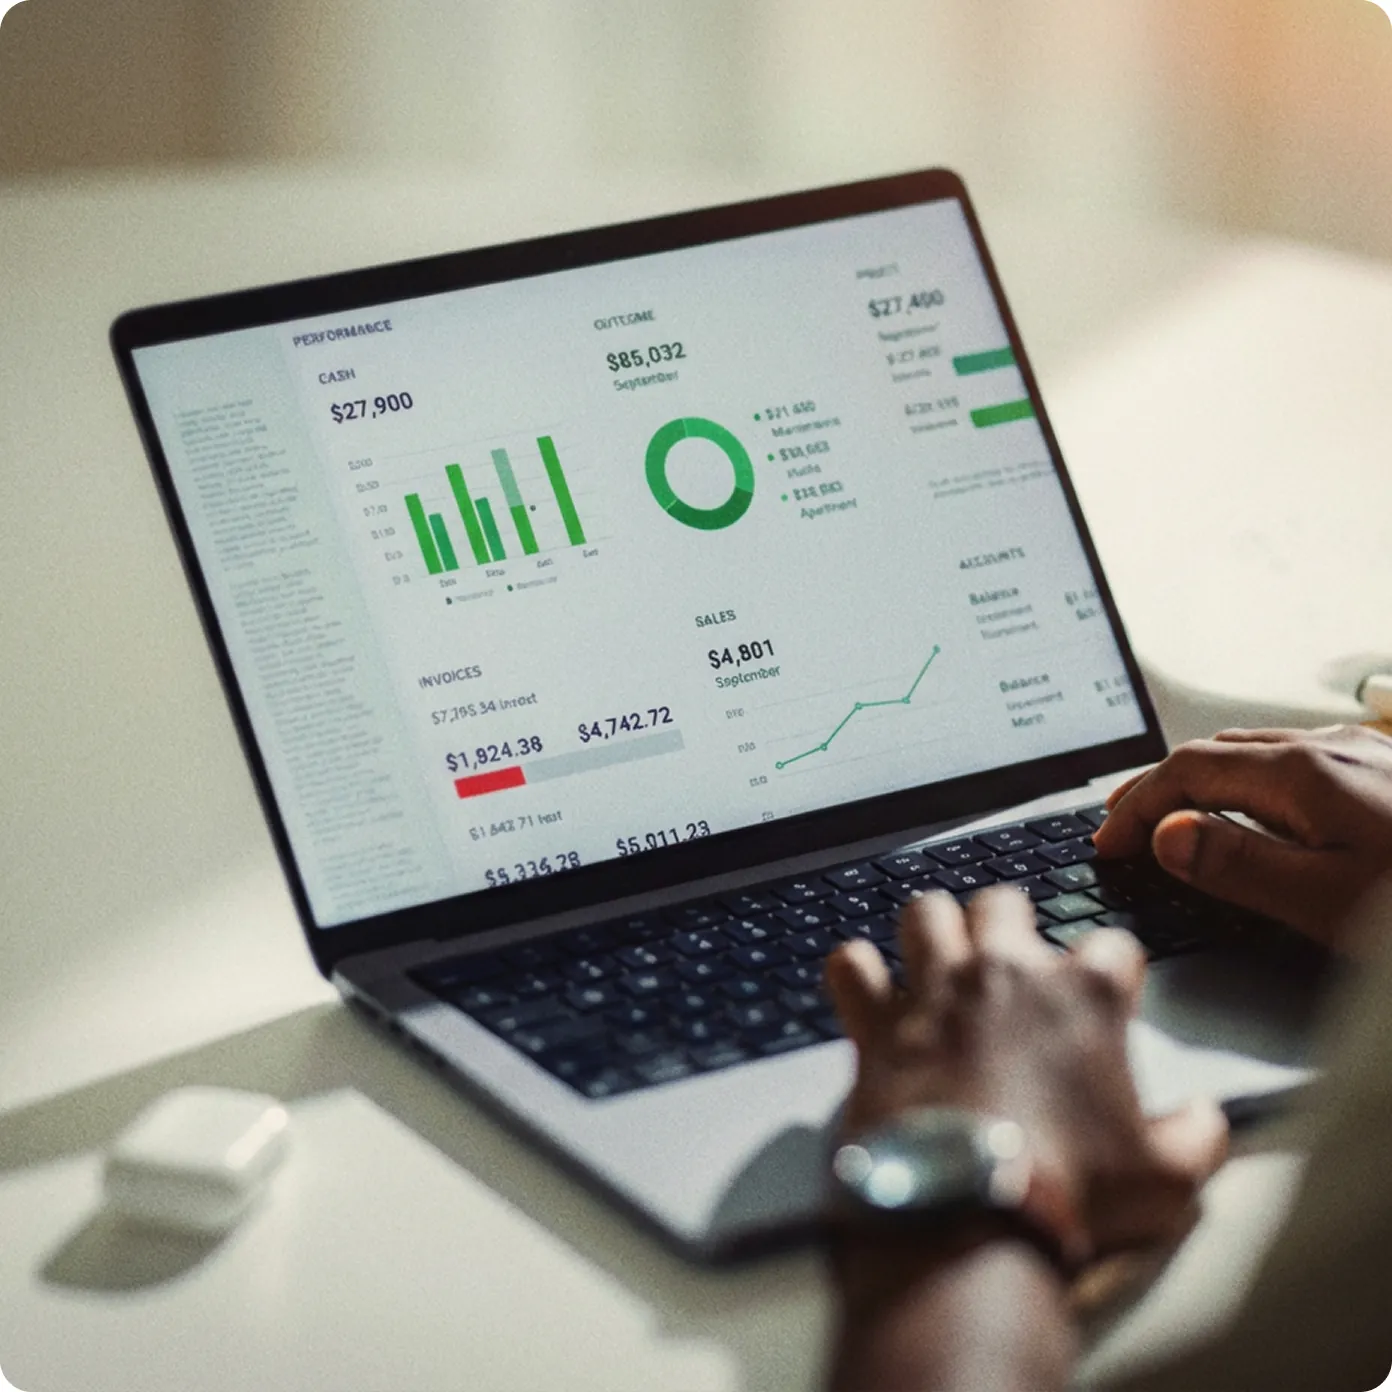
Every digital interaction leaves a trace, but raw data alone isn’t enough to guide decisions. Understanding how users behave on your site, which activity drives results, and where opportunities are being missed is essential.
Our web analytics team helps you make sense of this data, giving you clear insights that can be acted on immediately. With a solid understanding of your audience and performance, you can focus on strategies that work and make better informed decisions.
We provide end-to-end web analytics solutions designed to show every step in the website customer journey:

Implementation & Tagging
Accurate tracking across websites, apps, and campaigns.

Custom Dashboards & Reporting
Bespoke visualisations that make insights clear and actionable.

Conversion & Attribution Analysis
Understand which channels, pages, and campaigns drive value.
Optimisation Recommendations
Data-driven strategies to improve SEO, paid media, and user experience.
Training & Support
Empower your team to leverage analytics confidently and independently.
Impact that matters
By gaining a greater understanding of how users interact with their website, our clients see measurable improvements across their digital marketing efforts. Campaigns become more efficient, SEO performance improves, and paid media delivers higher ROI.
By turning data into actionable insights, we help teams make faster decisions, reduce wasted spend, and uncover growth opportunities that might otherwise go unnoticed.
The result is smarter marketing, more confident decision-making, and clear, tangible business outcomes.
connected services
Your trusted partner for web analytics
Web analytics is the bridge between data and results. We help you move beyond assumptions, understand customer behaviour in depth, and invest in initiatives that work. With our guidance, marketing becomes precise, campaigns become more effective, and your business grows smarter with every insight.


Testimonial
“I’ve been really impressed with the work the team at Adapt have done for us. We were originally only looking for support on Conversion Optimisation, but thankfully we discovered the great work they’re capable of with Analytics and Data Studio too.”
– Matt Cooksley | Grant Thornton
our partners

Frequently asked questions
Yes. We track and consolidate data across websites, apps, social media, and paid media campaigns.
We track performance improvements, conversion rate increases, reduced wasted spend, and campaign optimisation results. Web analytics itself is a tool to uncover and quantify ROI across marketing efforts.
Yes. We implement tracking that is GDPR, CCPA, and privacy-compliant while still capturing the data you need for actionable insights.
Yes. We provide training, documentation, and ongoing support to empower your team to leverage data independently.
why adapt?
Where global search meets cultural intelligence.
With a global network of data analysts, strategists, and UX specialists, we combine cultural intelligence with digital insight to help brands scale internationally with confidence.
What sets Adapt apart is our integrated approach: web analytics, data visualization, and user experience in a single workflow. We transform complex data into actionable insights, ensuring every design, journey, and interaction is culturally relevant and optimised for performance.