Data Storytelling: The Essential Skill Everyone Needs
Written byAli GatehouseData and Insights Manager
Topic
Date15.10.18
Who doesn’t love Google’s Chief Economist, Dr. Hal R.Varian? His insights are reliably interesting and remarkably prescient. None more so than this little nugget, taken from an interview with McKinsey & Co way back in 2008:
"The ability to take data - to be able to understand it, to process it, to extract value from it, to visualize it, to communicate it -that’s going to be a hugely important skill in the next decades."
Data has incredible potential value but unless insights are identified and translated into actions, none of this value will be realised. Storytelling has been an integral part of our lives for thousands of years. Stories take advantage of human cognition; they build connections and context around facts in order to make them more memorable.
When you analyse your insights as a data story, you appeal to both the logical and the emotional sides of the brain, massively increasing the chances that those insights will actually be understood and acted upon.
Data Storytelling Defined
Data storytelling is the process of translating data analyses into insights in order to influence a business decision or action. With the rise of digital business and data-driven decision making, data storytelling has become a critical skill.
The Proof is in the Statistics
People hear statistics but they feel stories.
Memorability: A study at Stanford found 63% could remember stories, but only 5% could remember a single statistic.
Persuasiveness: Save the Children tested two variations of a brochure. The story-based version generated donations per participant that were 200% higher than the pure statistical version.
Engagement: Data visualization expert Stephen Few said, “Numbers have an important story to tell. They rely on you to give them a clear and convincing voice.”
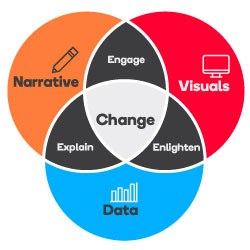
These three elements work together to create an engaging data story:
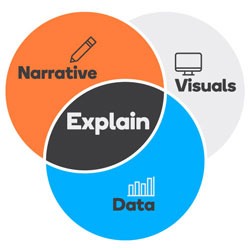
Explain
Narrative about the data, without visuals is sufficient to explain to your audience what’s happening.
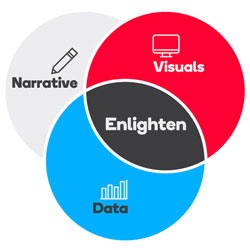
Enlighten
Visuals of the data, without narrative, can enlighten the audience to insights and patterns they would not see without charts or graphs.
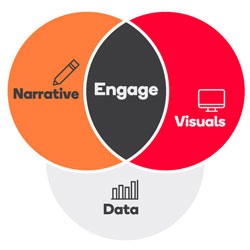
Engage
Narrative and visuals combined and used together can engage and entertain an audience.
Change
Finally, a data story combines the right visuals and narrative with the right data in the right context. This can influence and drive change.
In Conclusion
A recent comment by Snapapp stated that 90% of the world’s data has been created in the last two years. This is only going to get more pronounced. Insights will be missed if they are not successfully analysed and communicated into data stories.
This skill is critical to deriving value from the data. Data tells you what’s happening, stories tell you why. When you put them together, great change is possible.