First and foremost, you should expect that the majority of your website's visitors aren't going to convert during a particular session.
As marketers it’s important to steer our thinking towards the user and understand the many touchpoints that precede a conversion. Seeing the first session as an opportunity to convert is potentially very narrow-minded and restrictive.
Having said that, if your users aren’t converting after numerous sessions/touchpoints there may be a good reason. If that’s the case, it’s vital that you uncover why.
This is where qualitative analysis comes into play. A major part of conversion research.
Qualitative Conversion Analysis
Qualitative analysis moves away from typical data analytics by offering a perspective on why something is happening. In most, and also best cases, it does this by understanding the voice of the customer.
As detailed in a previous blog post, the process of conversion rate optimisation typically starts with uncovering insight from your website analytics tool.
Assuming a good analytics set-up is in place (tracking all your macro and micro conversions), web analytics is great at uncovering...
- Which pages aren’t performing
- Particular segments of users not converting
- Potential problem areas; where users are dropping out on the path to conversion
However, analytics doesn’t always give you the full picture and can often lead to more questions than answers.
For example, you may uncover through analytics that a high proportion of visitors drop out when visiting your pricing page. Or, you discover an abnormally high percentage of visitors abandon their basket. This is a useful finding, but it’s only a starting point.
The next logical question is to ask why. Why do visitors drop out on the pricing page? Why do users abandon their basket?
Of course, you can build up your own hypotheses but this is pure assumption. Instead, get a more evidence-based hypothesis through qualitative insight. Understand the true voice of your customer.
At SearchStar we typically use a wide range of techniques to uncover qualitative insight:
In this post I’d like to introduce you to on-site surveys, otherwise known as web polls.
What Are On-Site Surveys?
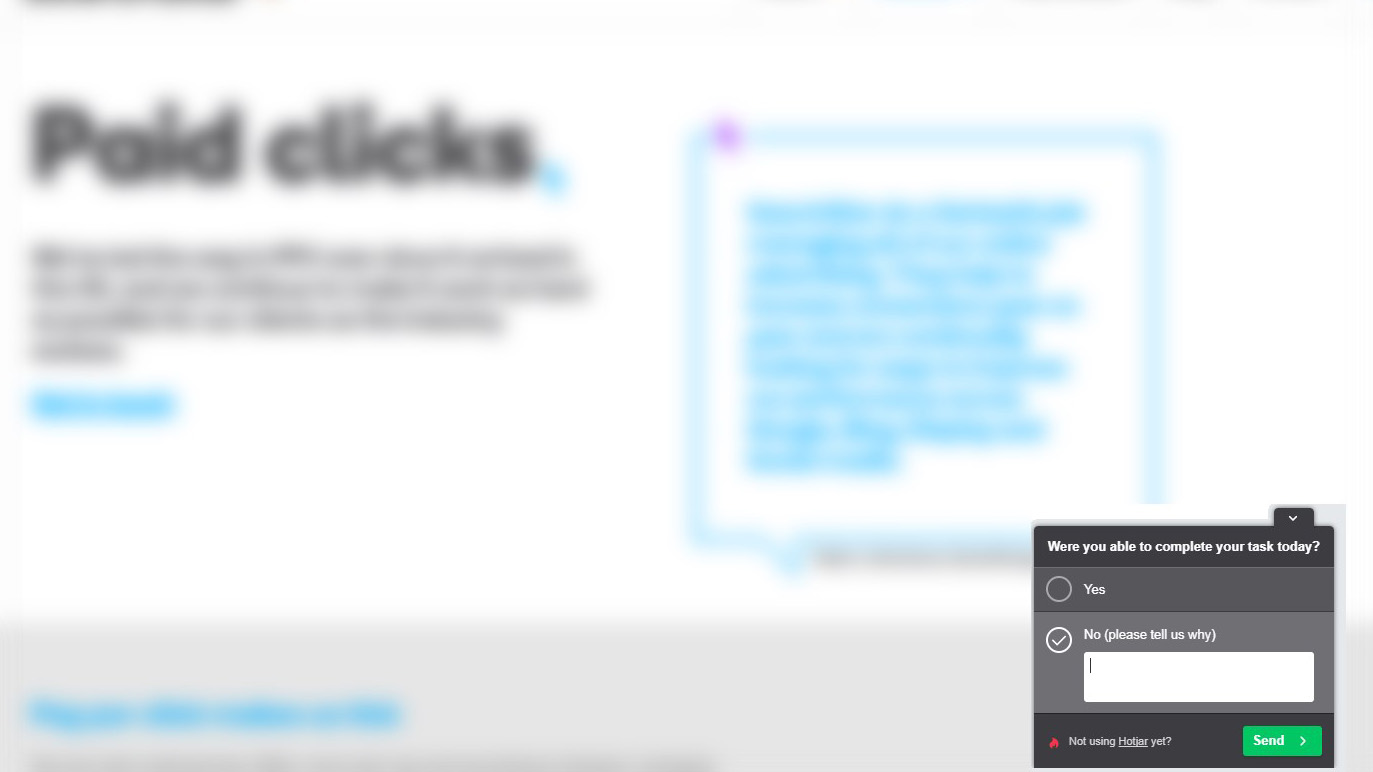
On-site surveys are type of pop-up box that appear to the visitor when browsing your website. They’re based on certain targeting rules; number of pages visited, time delay, scroll length, exit intent.
They offer the ability to ask your users open ended questions, predetermined answers (radio button and checkboxes), satisfaction ratings, net promoter score amongst other things.
This is an example of how an onsite survey might appear:
Why Should I Use an On-Site Survey?
On-site surveys can provide insights in order to optimise your website, improve your marketing and help develop your product/service.
In short, you can:
Uncover UX issues
Understand challenges, fears and concerns users face
Understand root causes for abandonment
Distinguish visitor segments and motivations
Figure out who the customer is, feeding into accurate customer personas
Uncover the motivations behind user conversion
Find out how users shop (comparison to competitors, which benefits they seek, what words they use)
Identify demand for new products or improvements to existing products
Learn where visitors first heard of you
Through all of these, we’re attepting to learn what friction exists in the conversion process.
What fears do they have about handing over their credit card number? What doubts do they still have about your product/service? What’s stopping them from buying – emotionally, functionally or otherwise?
You can then use this information to hypothesise A/B tests and improve conversion rates.
Asking the Right Questions
Before considering an on-site survey, you need to define clear objectives. What information do you need? Why do you need it? Who are looking to target? When is it appropriate to ask the question? Do you have ability to take action based on the insight?
On-site surveys can be used to gather all types of voice of customer feedback. At SearchStar we typically use open-ended questions. These provide the greatest level of insight as you’re drawing out the direct voice of the customer.
Here are some of our favourite open-ended questions:
What is the purpose of your visit to our website today?
Were you able to complete your task today? (If not why not?)
What would change your mind about completing your purchase?
Is there anything stopping you from contacting us today?
What made you sign up/buy from us? (On thank-you page)
Did you consider any other companies/suppliers? (On post-conversion page)
What’s the one thing that nearly stopped you from buying from us?
Is there anything missing that you couldn’t find the answer to?
On-Site Survey Tools
HotJar: A popular conversion tool. In addition to their triggered polls, they also offer funnel tracking, session recordings, heat maps and more. Good price and the free version is extensive.
GetSiteControl: Aside from surveys it contains a number of helpful widgets, including email opt-in forms, contact forms, popups, share buttons and live chat. (Free version has good capability with plans starting $19 thereafter).
Qualaroo: A popular on-page survey tool for requesting feedback. Easy to set-up and target customers at the right time. (Plans start from $99/month).
VWO: Aside from it being an A/B testing tool it also offers heatmaps, personalisation tools and on-page surveys. (Plans start from $299 /month).
Webengage: As well as push notifications and pop-ups the tool offers web surveys. The free version goes far if you’re a relatively small organisation.
How Many Responses Do I Need?
It’s not wise to take insight and action based on a single response. This may be an outlier or an edge case. Typically, you’ll want to gather at least 200 responses.
Obviously, the more responses the better, but there comes a point of diminishing returns. Analysing 10,000 responses would take up a lot of resource and it’s likely you’ll see a similar result with just 1,000 responses.
The most important thing is to spot patterns in responses. See if your customer responses validate or invalidate your website analytics and your own observations. Hopefully it'll make sense and you can A/B test to prove or disprove findings.
Analysing Responses
There are a number of ways you can analyse survey responses. Multiple choice surveys are relatively simple. However, if you have an open-ended survey that contains multiple lines of text things can get slightly more difficult.
In this scenario, we would typically advise visualising the responses in a word cloud (see below). This is so you can identify the most common words used by customers and uncover any immediate topics.
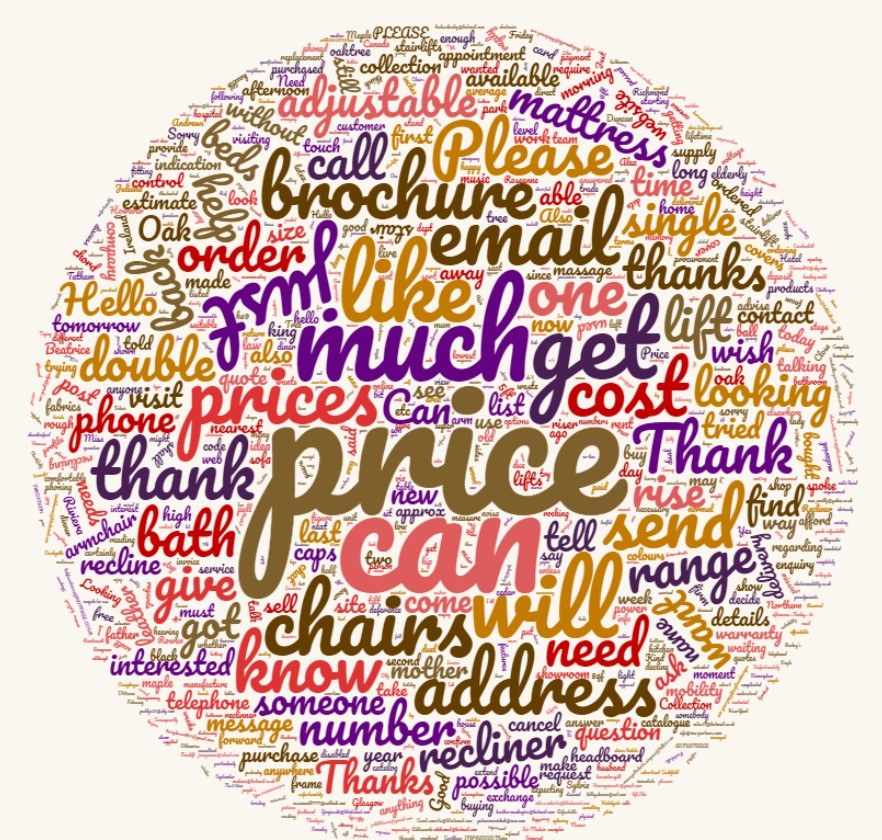
The next step comes the more important part. Upload all the responses (the raw data) to Excel or Google Sheets and go through a process of categorisation and scoring.
Spot trends on topics and create a separate column for each of the topics or categories. You can then scan through responses and mark with a scoring of 1 for each column it relates to.
For example, suppose your onsite survey asked ‘What would change your mind about completing your purchase?’, your worksheet could look like the below:
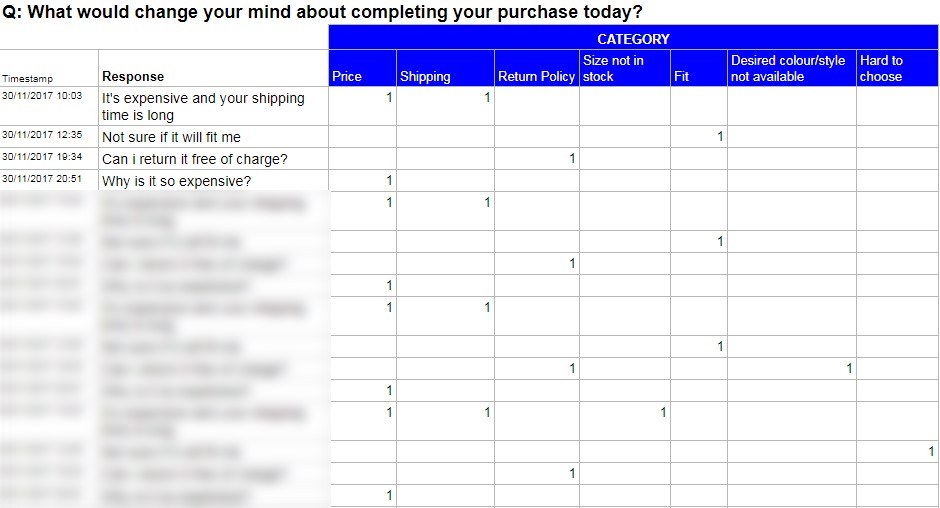
Once you’ve given each response a category you’ll be able to score the totals and identify the most common issues that need to be addressed.
Going through a scoring process allows you to present the data quantitatively. You can then easily display the data visually using graphs (useful when you need to present your findings).
Tips (when categorising/scoring)
Beware of biases! Don’t let your own opinions influence your analysis (confirmation bias)
Break up the work. Fatigue can make you quickly jump to conclusions. Working in teams or doing the work over different periods can help ensure your analysis remains objective
As you go through the categorisation process, always make separate notes for any specific insights you uncover or need further investigation.
Case Study
A travel client of ours wanted to know where visitors dropped off when selecting a holiday package. The ultimate goal was to increase online holiday bookings.
From Google Analytics analysis it was clear which area of the website was leaking. Looking at user journeys we identified a huge percentage of visitors dropped out on the results page after using their holiday search tool.
The next step for us was to discover why. This is where we utilised onsite surveys as part of this qualitative analysis.
Objective: Uncover why users abandon the holiday results page. Find out what needs to addressed on the page to reduce friction and persuade more users to progress.
Question: The question appeared to desktop users when they demonstrated exit intent.
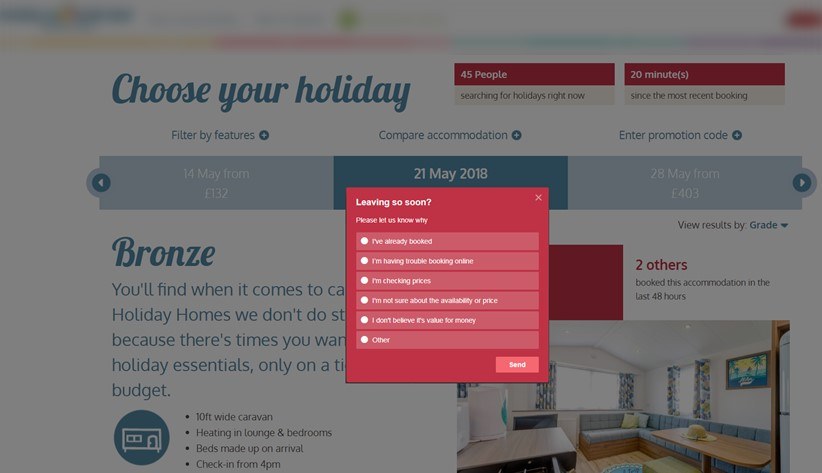
Result: From 1032 responses, 50% selected ‘I’m checking prices’.
Insight: At least half of users abandoning the holiday results page were price sensitive and comparison shopping with other holiday providers.
Therefore, the client needed to do a better job of communicating their USPs, reasons to choose their holidays (versus a competitor), showcase what’s included in the holiday package and why it’s great value for money.
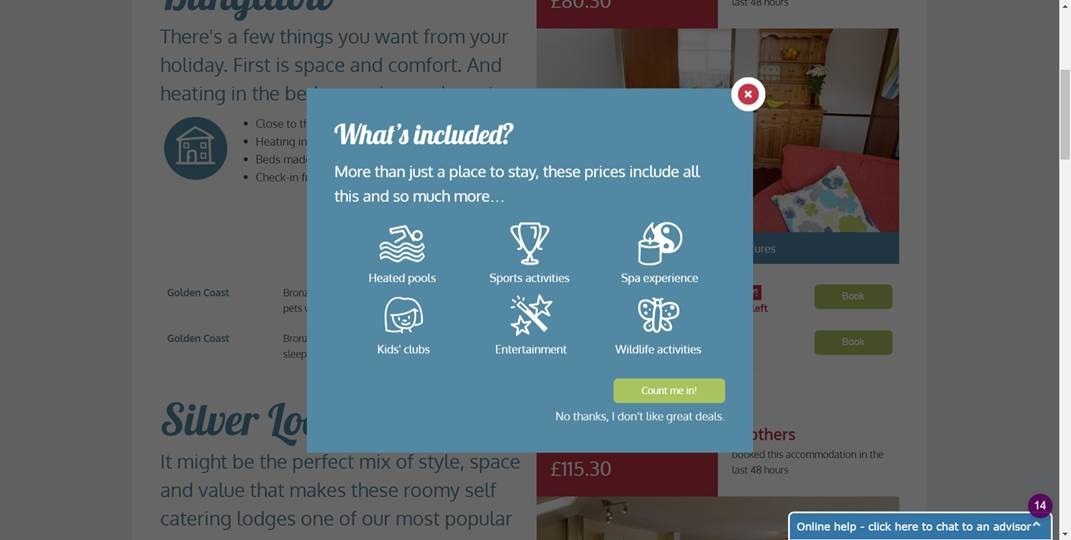
Hypothesis & Result: By showcasing what’s included within the price (and why it’s great value) we expected a lower drop off from users abandoning the holiday results page. We displayed this when the user demonstrated exit intent.
The result was higher click through rate and less abandonment. Ultimately, this helped to increase conversion rate (from users getting to the results page). This was a great result that stemmed from analytics and qualitative insight through an onsite survey.
Need help improving your website performance? Want to understand why your users don’t convert? Contact us today hello@search-star.co.uk or 01225 58 38 38.